Google Sheets trading journal template (free): copy it in one click
A free trading journal for Google Sheets that you copy into your own Drive in one click. Type the trade and points, P&L, risk and R fill in by themselves. Grade it on how well you followed your plan, tag the mistake, and the dashboard shows what each mistake has cost you so far. It works for futures, forex, stocks and crypto.

The short version
Make a copy, delete the five example trades and log every trade the same day. On Friday the dashboard shows your most expensive mistake and whether you trade your plan. When typing trades gets old, Actal does the same from your platform's export file, and it has a free plan.
- You take a few trades a day
- You want a journal on your phone and laptop for free
- You want to share it with a mentor in one click
- You like changing columns and formulas yourself
- You'd rather import trades than type them
- You want every trade checked against your rules automatically
- You want your stats by trade number, after a loss and by size
- You want friends or a group to see your journal
Get your copy
- Click Make a copy at the top of this page. Google Sheets opens and asks whether you want a copy.
- Click Make a copy. It lands in your own Google Drive as "Copy of Actal Trading Journal Template". Rename it to whatever you like.
- Delete the five example trades on the Trades tab and the two skipped setups on the Skipped tab.
- Rename the setups and mistakes on the Lists tab to your own.
- Log your next trade the same day you take it.
Your copy is private. Nobody sees it, me included, unless you share it. The shared original is view-only so nobody can change it for everyone else, which is why you can't type in it.
Rather use Excel, or work offline? The same template is a .xlsx download, and the Excel trading journal guide shows how the formulas work if you'd rather build your own.
What's in the template
| Tab | What it does |
|---|---|
| Trades | One row per trade. Points, gross, net, risk and R calculate themselves. You add the setup, whether it was in your plan, a grade from A to F and the mistake if there was one. |
| Skipped | Setups you didn't take and why, so a hesitation has a price too. |
| Dashboard | Win rate, expectancy, profit factor, results by grade, what each mistake cost, and in-plan vs off-plan P&L. |
| Weekly review | One row a week, with a process score out of 100 and the one thing you're fixing. |
| Lists | The dropdowns. Rename the setups and mistakes to your own. |
| Read me | The short version of this page, inside the sheet. |
How to log a trade, column by column
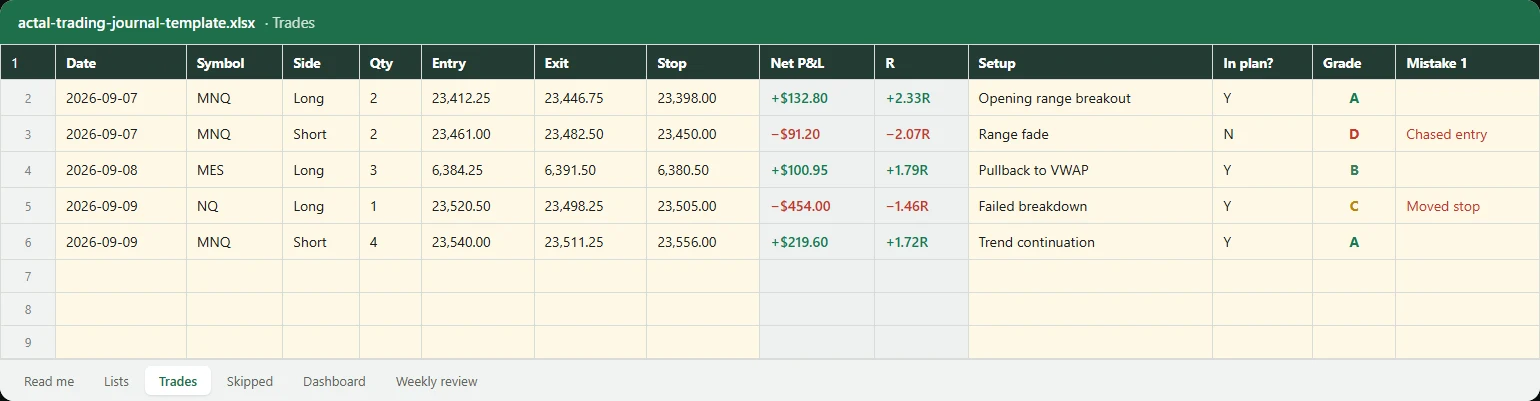
Amber cells are yours to type in. Grey cells are formulas, so leave them alone. This is the first example trade in the template, two MNQ long:
| Column | Example | What goes in it |
|---|---|---|
| Date | 2026-09-07 | The day of the trade. The weekly review counts trades by this date. |
| Symbol | MNQ | Whatever you call the market. |
| Side | Long | Long or Short, from the dropdown. |
| Qty | 2 | Contracts, lots or shares. |
| Entry and Exit | 23,412.25 and 23,446.75 | Your average prices if you scaled in or out. |
| Stop | 23,398.00 | Where the stop was when you got in. Leave it empty and Risk $ and R stay empty. |
| Point value | 2 | What a full point is worth on one contract. The table below has the common ones. |
| Fees | $5.20 | Commission and fees for the whole round trip. |
| Points, Gross P&L, Net P&L | 34.50, $138.00, $132.80 | Formulas: points times point value times quantity, then minus fees. |
| Risk $ and R | $57.00 and 2.33R | Formulas: distance to the stop times point value times quantity, and net P&L divided by that. |
| Setup | Opening range breakout | From your own list on the Lists tab. |
| In plan? | Y | Was this a trade your plan allowed? Y or N. |
| Grade | A | How well you followed your plan, A to F. Not how much it made. |
| Mistake 1 and 2 | Empty | Pick from your mistake list if something went wrong. Up to two per trade. |
| Note and Lesson | Close outside the range, stop under the mid, trailed after 1R. | One line on what happened, one on what you'd repeat or change. |
The point value is the only column people get wrong. It's what a move of 1.0 in the price is worth for one unit of whatever Qty counts:
| Market | Point value | Qty counts |
|---|---|---|
| MNQ / NQ | 2 / 20 | Contracts |
| MES / ES | 5 / 50 | Contracts |
| MGC / GC (gold futures) | 10 / 100 | Contracts |
| CL (crude oil) | 1,000 | Contracts |
| EURUSD, GBPUSD and other pairs quoted in USD | 100,000 | Standard lots |
| XAUUSD (gold CFD) | 100 at most brokers | Standard lots of 100 oz |
| Stocks and ETFs | 1 | Shares |
| Spot crypto | 1 | Coins |
For a pair quoted in another currency, like USDJPY, the P&L comes out in that currency. Either convert it or put the dollar result straight into Net P&L. If you'd rather work out point values with a calculator, the futures tick value calculator and the pip calculator do it.
Reading the dashboard
There's nothing to type on the Dashboard tab. It reads the Trades and Skipped tabs. With the five example trades it shows 5 trades, a 60% win rate, a net loss of $92 and a profit factor of 0.83. Read it in this order:
- What each mistake has cost you. The most negative row is your first fix. In the example it's Moved stop: one trade, -$454, more than the whole week lost.
- By grade. If your A and B trades make money and your C, D and F trades lose it, your setups work and the problem is execution. In the example the A trades made $352, the B trade $101, and the C and D trades lost $545 between them.
- Net P&L in plan vs off plan. In the example the four planned trades come to -$1 and the one off-plan trade lost $91.
- Missed setups and R left on them, from the Skipped tab. A setup you saw and didn't take is a mistake too. The example missed one worth 2.5R.
The weekly review in ten minutes
Each row on the Weekly review tab is one week. Type the Monday's date in the first column and the row counts that week's trades, how many you graded, the share graded A or B, the share with no mistake, the share in your plan and the setups you missed. The score out of 100 is 40% A and B trades, 35% clean trades and 25% trades in your plan. The example week scores 65.
- On Friday, read the mistake table on the Dashboard.
- Write one thing to fix next week as a rule you can check, like the example's "No trade within 15 minutes of a stop. Close the chart, walk."
- The Friday after, answer Did it happen? with Y or N.
That's the whole routine. One fix a week, checked a week later, does more than fifty stats nobody acts on. There's more on this in how to keep a trading journal, and seven filled-in journal entries show what a good row looks like.
Making it yours
- Setups and mistakes live on the Lists tab. Rename them and the dropdowns follow. The dashboard's mistake table shows the first 12 mistakes on the list, so keep the ones you make most at the top.
- Keep the grade scale (A to F) and the skip reasons as they are. The dashboard and the weekly review count them.
- Add your own columns after Lesson, like session or market type. Nothing reads them, so nothing breaks.
- There's room for 499 trades and 199 skipped setups. For more, copy the last row's formulas down and widen the dashboard's ranges, or start a new copy each year.
On your phone, and sharing it with a mentor
Install the Google Sheets app and the same file is on your phone. Dropdowns work on mobile, so logging a grade and a mistake after the session takes a few taps. Keep the typing for the evening on a laptop; on the phone, just grade and tag.
To share it with a mentor, click Share and add their email as a commenter. They can leave notes on single trades without changing your numbers.
Where Google Sheets runs out
- Typing every trade. With five trades a day that's 25 rows a week, and the days you skip are usually the bad ones.
- Partial fills and scaling in or out are hard to log by hand.
- It can't check your rules for you. A daily loss limit in a spreadsheet only works if you look.
- Breakdowns like "how does my trade after a loss do" mean building your own formulas.
That's what Actal is for: it reads your platform's export, checks every trade against your rules, and shows where the money goes, including after a loss, by trade number of the day and by size. There's a free plan, and Pro is $15 a month. Or stay with the sheet; it beats no journal at all.
Who wrote this
I'm Joakim. I trade index futures full time and coach traders at Jusell Trading Academy. Every student I coach starts with a spreadsheet like this one, so the columns are the ones I actually look at when we go through a week together.
Questions people ask
Drop in one export. In a minute Actal grades the trades it can, prices the mistakes you tagged, and tells you the first thing to fix. Free plan, no card.

Full-time index futures trader. Coaches traders one-on-one at Jusell Trading Academy, five students at a time, since 2020. No platform was built for developing traders, so he had his own coaching software built; old students loved it and kept coming back, and Actal is that software turned into a proper journal for what matters.